
The price of an inspection system, or the absence of one for manual inspection, tends to be the least significant number in making an inspection system decision. You buy the system before you’ve even used it. The expense that truly determines which approach is most cost-efficient is running the system: headcount and turnover, threshold tuning and requalification, false rejects, and deviations. All of these compound quietly for years while the purchase order has been filed away.
Run manual inspection, traditional rule-based AVI, and AVIS by Boon Logic through the same five-year window on the same line, and the ranking changes. This is that comparison, using a representative base case: a 5-million-unit-per-year, $10-per-unit sterile injectable line, the same case used throughout The CFO’s Guide to Inspection ROI.
What manual inspection costs over five years
With manual inspection, there is no deploy event and no line item on a capital budget. This is exactly why the five-year cost of manual inspection is easy to underweight. It’s a continuous staffing model. A 24-hour, 5-day-per-week operation typically requires 12 to 20 qualified inspectors per line, each carrying a fully loaded cost of $80,000 to $130,000. Each line requires 6 to 12 months to qualify, with turnover at an annualized rate of 20 to 40% in production environments. Every line change restarts the qualification clock and opens a capacity gap.
False reject rates on complex products can run 10 to 20% under manual inspection, while accuracy can degrade further with fatigue, shift transitions, and inter-inspector variability. This is why many facilities run duplicate inspection passes to compensate for these degradations. No single invoice shows a five-year total; the true five-year cost is the running sum of headcount, turnover, and yield loss, and it is usually the largest number in the comparison because no one ever adds it up.
What traditional, rule-based AVI costs over five years
Rule-based AVI trades manual inspection headcount for a capital purchase and an engineering program. Implementation runs 18 to 24 months from purchase order to full automation, including defect-catalog assembly and validation. However, each new SKU requires weeks to months of threshold tuning against that catalog before it is production-ready.
False reject rates on complex products, lyophilized vials, powder-filled containers, and suspensions in molded glass can run from 10 to 30%, often at the high end of that range on exactly these formats.
The threshold-tuning required to keep those systems within internal alert limits is also a major source of inspection-driven deviations, so the recurring cost does not disappear with automation. Threshold-tuning subjectivity and challenge-set adequacy are recurring 483 themes on facilities running rule-based AVI, and every new defect type, SKU change, or process shift reopens the tuning cycle and its associated requalification cost. These aren’t isolated to rule-based systems. We cover why supervised machine learning runs into the same structural wall in the failure modes behind rule-based AVI and supervised ML.
What AVIS costs over five years
AVIS is unique. It can be either a capital purchase or an upfront subscription, plus hardware, integration, and validation, followed by a locked model that doesn’t require the recurring tuning cycle inherent in the other two approaches. Recipe creation runs under 60 minutes per SKU on roughly 500 pre-inspected compliant units, and time from purchase order to qualified production runs about six weeks.
Documented false reject rates run 1% to 6% on complex products, with a typical rate of 3% to 4% and case-study performance of 2.7% on 20-mL powder-filled molded glass vials at 98% defect detection accuracy threshold. The AVIS model is locked after qualification; there is no scheduled retraining, threshold-tuning cycle, or defect-library maintenance program. Line changes require a deliberate, human-authorized retraining event with its own qualification baseline. This enables predictable maintenance costs. A locked model with full IQ/OQ/PQ documentation and a 21 CFR Part 11 audit trail also removes the two most common AVI-related 483 themes: library completeness and model drift.
Comparing production costs and efficiencies across inspection systems
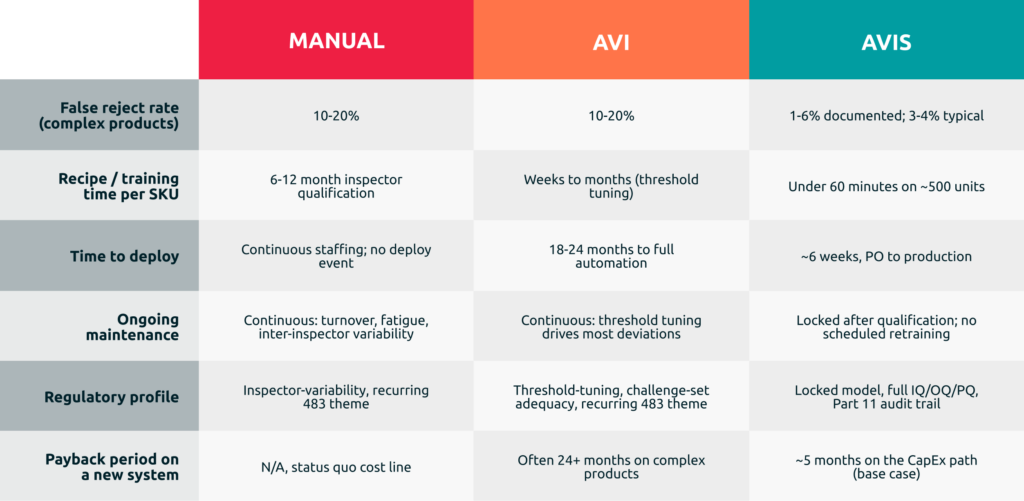
Source figures: The CFO’s Guide to Inspection ROI and Pharmaceutical Visual Inspection: Four Modalities, Four Financial Profiles (Boon Logic, 2026). Base case assumes a 5M-unit, $10/unit sterile injectable line; replace with your own volumes and unit economics during business-case development.
What the five-year math adds up to
On the base-case line, moving from a 10% to a 3% false reject rate alone recovers roughly $3.5 million a year in yield that would otherwise be written off as scrap. That’s for a single year. The number scales to $17.5 million a year on a $50-per-unit biologic. A facility generating one inspection-driven deviation per week at a typical $30,000 fully loaded cost spends roughly $1.5 million a year of QA and validation capacity keeping a tuning-dependent system within its limits. Re-inspection labor alone adds $610,000 a year at a 10% reject rate versus a 3% rate. None of those figures include the regulatory downside: with roughly 55% of FDA Complete Response Letters in recent years tied to manufacturing deficiencies rather than clinical issues, an inspection-methodology finding on a Pre-Approval Inspection is the largest single dollar swing in the model, and it does not show up on any of the line items above.
Run those mechanics through a full five-year model on AVIS’s base case. The result is a five-year net present value of approximately $24.9 million at a 10% discount rate, an internal rate of return around 280%, and a simple payback within five months on a $2.5 million total upfront investment, all of it before any credit for CRL avoidance or 483 remediation. Manual and traditional AVI do not produce a comparable five-year total because neither one is a five-year investment with a defined return. They are five years of recurring headcount or recurring tuning labor, layered on top of a false-reject rate that never gets structurally better.
The decision
Over a single year, manual and traditional AVI can look more cost-effective because neither carries a six- or seven-figure initial purchase price. Over five years, however, the comparison inverts. Manual inspection is dependent on frequent headcount turnover that scales with SKU count and shift coverage. The cost of rule-based AVIs is the dependency on continuous threshold tuning that scales with product complexity and SKU changes. These same tuning cycles are the leading source of the deviations it was supposed to prevent.
AVIS’s cost is front-loaded and then mostly flat because the model that gets qualified is the model that keeps running.
The base case above is illustrative. The two variables that move the outcome most are your line’s volume and the false-reject improvement you can actually achieve, and both depend on your product and current inspection performance. Run your own numbers rather than take the base case as given.
Use the AVIS ROI Calculator → Read The CFO’s Guide to Inspection ROI → Request a Demo