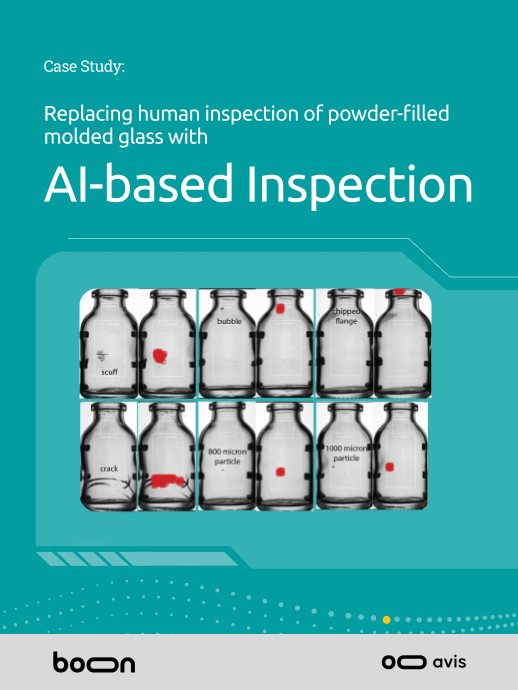


Payback, NPV, cash flow, and sensitivity analysis for AVIS by Boon Logic.
Visual inspection is among the most under-examined cost lines on a pharmaceutical P&L. It drives yield loss, qualification timelines, headcount, deviation investigations, and, in the worst case, CRLs and drug shortages. This briefing isolates where the dollars actually sit and quantifies the financial case for AVIS, Boon Logic’s unsupervised-AI inspection system, with a complete five-year cash flow model and sensitivity analysis.
- $24.9M — 5-year NPV at 10% discount rate (representative 5M-unit, $10/unit sterile injectable line)
- ~5 months — simple payback on $2.5M total upfront investment (hardware, integration, validation)
- ~280% — IRR over the five-year horizon under base-case assumptions
- $3.5M+ — annual yield recovery from reducing false rejects from 10% to 3% on a 5M-unit / $10 line
- ~$10M — estimated revenue impact per month of CRL-driven launch delay
- Under 60 minutes — AVIS recipe creation per SKU, vs. months for supervised AI or traditional AVI
For the CFO and CEO, the relevant question is not whether visual inspection is a quality function, it plainly is, but whether the inspection approach is consistent with the financial model the company has committed to investors. High false reject rates erase gross margin one batch at a time. Manual and rule-based AVI methods drive headcount and deviation costs that scale linearly with SKU count. And inspection-related findings are now a leading cause of Complete Response Letters, with roughly 55% of CRLs in recent years tied to manufacturing deficiencies rather than clinical issues.
AVIS (Automated Visual Inspection System) by Boon Logic is purpose-built around a different financial model. It trains exclusively on compliant product, requires no defect library, and is locked after qualification, producing documented false reject rates of 1 to 6% on complex products including lyophilized vials, powder-filled containers, and suspensions in molded glass. This guide quantifies what that means for revenue, cost of goods, qualification capital, and downside risk.
How to use this guide
The 18 financial drivers below are organized into six P&L categories: yield, time-to-market, regulatory downside, labor and operations, capital efficiency, and total cost of ownership. Each driver describes the underlying financial mechanic, the typical impact under legacy inspection (manual, supervised AI, or rule-based AVI), and how AVIS changes the math. Figures are illustrative ranges drawn from public benchmarks and should be replaced with your own volumes, unit economics, and discount rate during business-case development.
Section 01 · Yield recovery and false reject economics
False rejects are not a quality nuisance, they are gross-margin destruction in real time. The single largest near-term ROI lever is reducing rejects of compliant product.
Driver 1 · Direct yield recovery from lower false reject rates
The financial mechanic. Every compliant unit ejected by an inspection system is finished-goods value written off. Industry-published false reject rates run 10 to 30% for traditional AVI and 10 to 20% for manual inspection on complex products. AVIS-documented false reject rates range from 1 to 6%, with case-study performance of 2.7% on 20 mL powder-filled molded glass vials at 98% defect detection accuracy.
Illustrative impact. On a 5M-unit line at $10 finished-goods value, moving from a 10% to a 3% false reject rate recovers roughly $3.5M annually, before any benefit from increased throughput or reduced re-inspection. On a sterile injectable line at $50/unit, the recovery scales to $17.5M.
Driver 2 · Avoided deviation and investigation expense
The financial mechanic. Each batch that crosses an internal alert or action limit on rejects triggers a deviation: investigation hours, QA review, CAPA documentation, and frequently a hold on the batch. Industry costing puts a routine pharmaceutical deviation at $5,000 to $50,000 fully loaded; a full investigation with batch disposition can easily exceed $100,000.
Illustrative impact. A line generating one inspection-driven deviation per week at an average $30,000 fully loaded cost is consuming roughly $1.5M per year of QA and validation capacity. AVIS’s baseline-learning approach removes the threshold-tuning cycle that produces the majority of these events.
Driver 3 · Reduced re-inspection and rework cost
The financial mechanic. When AVI false reject rates exceed internal limits, the standard response is manual re-inspection of ejected product. Re-inspection is slow (3,000 to 6,000 units per inspector-day), error-prone, and consumes the same scarce trained-inspector capacity needed for line release.
Illustrative impact. A 5M-unit line ejecting 10% (500K units) into manual re-inspection consumes roughly 100 inspector-days versus about 15 inspector-days at a 3% reject rate. At a fully loaded inspector cost of $90/hour, that delta alone is approximately $610K annually, on top of the recovered yield.
Section 02 · Time-to-market and qualification velocity
Recipe creation and changeover are not engineering line items, they are revenue dates. Compressing them is the same accounting event as pulling launch revenue forward.
Driver 4 · Accelerated recipe creation per SKU
The financial mechanic. Supervised AI and rule-based AVI systems require thousands of labeled defect images and weeks-to-months of engineering work to build a recipe for a complex product. AVIS requires only about 500 pre-inspected compliant units and produces a qualification-ready recipe in under 60 minutes.
Illustrative impact. For a sponsor with 12 SKUs in active development, the difference between months-per-recipe and an hour-per-recipe is the difference between a multi-year qualification roadmap and a quarter. At an estimated $10M per month of delay for a single blockbuster launch, even a one-month pull-forward represents a material P&L event.
Driver 5 · Faster product changeover on multi-SKU lines
The financial mechanic. High-mix CMOs, 503B facilities, and contract manufacturers carry direct OEE penalties when changeover takes hours or days. AVIS stores complete recipes and switches between them in minutes with no model rebuilding or re-qualification.
Illustrative impact. A line running four changeovers per week at a 4-hour reduction per event recovers roughly 800 hours of production capacity per year. On a $4,000/hour fill-line basis, that is $3.2M of recoverable line value before any margin contribution.
Driver 6 · Lower-volume products become economically inspectable
The financial mechanic. Traditional AVI economics typically require around 10M+ units per year per SKU to justify recipe-development investment. That threshold has historically excluded orphan products, clinical supplies, 503B compounded products, and CMO-run portfolios from automation.
Illustrative impact. AVIS recipe economics are flat with respect to volume. The cost to qualify a 500K-unit/year SKU is roughly the cost to qualify a 50M-unit/year SKU. For a 503B or CGT manufacturer, that effectively converts a previously manual cost line into an automated one across the full portfolio.
Section 03 · Regulatory downside and the cost of failure
A CRL or 483 tied to inspection methodology is the largest single financial event most drug programs ever experience. Inspection technology is a direct lever on the probability and severity of that event.
Driver 7 · CRL avoidance and remediation cost
The financial mechanic. Approximately 55% of CRLs in recent years have been tied to manufacturing deficiencies, not clinical failures. Receipt of a CRL stops the FDA review clock and typically delays approval by 6 to 12 months, longer when new studies are required, with delay-costs commonly cited at roughly $10M per month for a major launch. Inspection-system findings are a recurring root cause.
How AVIS changes the math. AVIS produces full IQ/OQ/PQ documentation aligned to FDA Process Validation guidance, EU GMP Annex 1 (2022), and USP <1790>, with a locked-after-training model and 21 CFR Part 11 audit trail. This is the structural inspection profile FDA investigators are explicitly looking for during a Pre-Approval Inspection.
Driver 8 · Form 483 remediation expense
The financial mechanic. Form 483 observations require a written response within 15 business days and frequently trigger remediation programs running into the millions. Consulting groups commonly cite remediation programs of $1M to $10M+, with executive time, third-party consulting, and re-validation as the dominant cost categories. AVI-related observations are routinely among the most-cited topics on a PAI.
How AVIS changes the math. A locked, qualified, baseline-trained model with documented detection of novel defect types eliminates the most common AVI-related observation themes: inadequate challenge sets, undocumented model adaptation, and threshold-tuning that reintroduces inspector subjectivity.
Driver 9 · Drug-shortage and supply-continuity risk
The financial mechanic. FDA reporting consistently identifies cGMP enforcement actions as a leading driver of new drug shortages each year. A shortage event creates direct revenue loss, market-share loss to competitors, reputational and ESG exposure, and, in many therapeutic categories, a public-health narrative that draws Congressional attention. The sponsor’s own inspection methodology is a controllable input into this risk surface.
How AVIS changes the math. Detection of any deviation from the compliant baseline, rather than only enumerated defect types, reduces the structural “unknown unknowns” exposure that drives inspection-related shortages.
Section 04 · Labor and operational efficiency
Manual inspection is the single largest variable-cost line item in many sterile injectable operations. The headcount math compounds with SKU count and shift coverage.
Driver 10 · Trained-inspector headcount and turnover
The financial mechanic. Qualified visual inspectors carry fully loaded costs of $80K to $130K, require 6 to 12 months to fully qualify, and have annualized turnover commonly cited at 20 to 40% in production environments. Each replacement re-runs the qualification cycle and creates a transient capacity gap.
Illustrative impact. A 24/5 inspection operation typically requires 12 to 20 qualified inspectors per line. Reducing manual inspection load by 70% through automation effectively converts a $1.5M to $2.5M annual line cost into capital-efficient hardware plus a small QA-oversight team.
Driver 11 · Inspector-fatigue and consistency premium
The financial mechanic. Manual inspection accuracy degrades measurably with fatigue, shift transitions, and inter-inspector variability, driving additional re-inspection passes (typically 100% + 100%) and elevated AQL sampling. Each additional inspection pass is direct labor and direct capacity loss.
How AVIS changes the math. Consistent baseline-trained detection across all shifts removes the inter-inspector variance that drives the duplicate-pass model, converting a labor-bound process into a fixed-cost automated one.
Driver 12 · OEE and throughput uplift
The financial mechanic. Inspection is frequently the bottleneck constraint on a sterile fill-finish line. False rejects drive line stops and segregation activities; manual inspection caps throughput at human pace. Both depress OEE.
Illustrative impact. A 5-percentage-point OEE improvement on a $4,000/hour fill line operating 6,000 hours per year is roughly $1.2M of additional capacity, capacity that either fills new contracts (CMO) or pulls inventory build forward (sponsor).
Section 05 · Capital efficiency and asset utilization
Inspection technology choices show up on the balance sheet as well as the income statement, in the size of qualification reserves, inventory tied up in re-inspection, and the duration of validation projects.
Driver 13 · Working-capital release from compressed re-inspection cycles
The financial mechanic. Product held for re-inspection is finished-goods inventory not yet released to revenue. On long re-inspection queues, common at 10%+ false reject rates, working capital tied up can be material, particularly for high-value biologics.
Illustrative impact. On a $50/unit injectable line at 5M units annually, a 30-day reduction in average re-inspection turnaround releases approximately $20M of cash from inventory.
Driver 14 · Lower qualification CapEx and project duration
The financial mechanic. Validation programs for legacy AVI systems often run 12 to 18 months and tie up engineering, QA, and validation headcount that would otherwise be deployed against new product launches. AVIS’s under-an-hour recipe creation, combined with locked-model qualification, compresses the validation burn-rate dramatically.
Illustrative impact. A typical AVI qualification program is widely budgeted at $1.5M to $5M+ in internal and external spend. Compressing the timeline by 50% releases both cash and the most constrained resource in the company, senior validation engineers.
Driver 15 · Avoided sunk cost in defect libraries
The financial mechanic. Supervised-AI vendors require curated defect libraries, thousands of labeled images per defect type per SKU. Library curation, labeling, and ongoing maintenance is direct engineering and QA spend that does not transfer between SKUs and does not appreciate as an asset.
How AVIS changes the math. AVIS does not require labeled defect data and does not depend on a library to detect novel defects. The associated labor and storage cost line is removed entirely.
Section 06 · Total cost of ownership and risk-adjusted return
Purchase price is rarely the largest cost in an inspection program. The structural costs are recurring: maintenance, retraining, threshold tuning, requalification, and the ongoing exposure to a regulatory event.
Driver 16 · Ongoing model maintenance and threshold tuning
The financial mechanic. Supervised AI and rule-based AVI require continuous tuning as products, processes, and defect populations evolve. Each cycle consumes engineering time, QA review, validation overhead, and in many cases a partial requalification, costs that are rarely included in initial vendor pricing.
How AVIS changes the math. Because the AVIS model is locked after training, there is no scheduled retraining cost. Adaptation requires a deliberate human-authorized retraining event with its own qualification baseline, producing predictable, controllable cost behavior.
Driver 17 · Cost of detecting novel defects
The financial mechanic. For supervised systems, a new defect type that is not in the training library cannot be detected until the library is updated, the model retrained, and the system requalified, a cycle that is both a cost line and a quality-coverage gap.
How AVIS changes the math. Because AVIS flags any deviation from the compliant baseline, novel defect types are detected automatically without library updates or model retraining. This removes the structural library-expansion cost and the corresponding regulatory exposure.
Driver 18 · Risk-adjusted NPV of the inspection program
The financial mechanic. Most CFOs underprice the regulatory-event tail in inspection-program NPV because the historical event rate at the company is typically zero. The industry rate is not zero. With roughly 55% of CRLs tied to manufacturing and AVI-related observations a recurring 483 theme, the rational expected-value adjustment is non-trivial.
Illustrative impact. A modest 5-percentage-point reduction in the probability of an inspection-related CRL on a single $2B-NPV launch is a $100M risk-weighted swing, typically larger than the entire direct ROI of the inspection-system decision.
Section 07 · Capital structure: OpEx vs. CapEx
AVIS can be deployed under either a traditional CapEx model or a subscription OpEx model. The choice is a CFO decision, not a quality decision, and it materially shapes balance-sheet impact, EBITDA contribution, and procurement velocity. The two paths produce comparable five-year economics under base-case assumptions, but they sit very differently on the financial statements and on procurement timelines. Most pharmaceutical organizations have a CapEx threshold above which board-level approval and multi-quarter procurement cycles are required; the OpEx path is specifically designed to avoid that timeline.
| Dimension | CapEx path (purchase) | OpEx path (subscription) |
|---|---|---|
| Upfront cash outlay | ~$2.5M (hardware + integration + validation) | $0 (validation services typically prorated into subscription) |
| Recurring cost | ~$250K/yr software & support | $60K to $80K/month, all-inclusive |
| Balance-sheet treatment | Capitalized; ~7-yr depreciation; ~$357K/yr non-cash D&A | Operating expense; no balance-sheet impact |
| EBITDA contribution (Yr 1) | ~$6.6M (full savings less cash OpEx) | ~$6.1M (savings net of subscription fee) |
| Tax shield | ~$89K/yr from depreciation (at 25% rate) | Full subscription is tax-deductible OpEx |
| 5-year NPV @ 10% | ~$24.9M | ~$24.7M |
| Procurement velocity | CapEx review cycle (often 2 to 6 months) | Standard SaaS procurement (often <30 days) |
| Optionality / exit | Owned asset; resale or repurpose if discontinued | Cancellable per contract terms; preserves cash for redeployment |
| Best fit | Mature production lines with allocated CapEx; tax-optimized for long horizon | CMOs, 503Bs, CGT, and clinical-supply lines where speed and cash preservation dominate |
Under the base-case operating assumptions, both paths deliver substantially the same five-year value with payback inside Year 1. The CapEx path produces a marginally higher steady-state EBITDA contribution; the OpEx path produces materially better cash optionality, faster procurement, and zero balance-sheet exposure. For sponsors deploying AVIS across multiple SKUs or sites, blending the two, capitalizing the first line then subscribing on subsequent lines, is also a viable structure.
Section 08 · Five-year cash flow model
Representative case: a single sterile injectable line at 5M units/year and $10 finished-goods value per unit, currently inspected by a combination of manual and rule-based AVI with a 12% effective false reject rate. AVIS deployed under the CapEx path. Discount rate: 10%. All figures in $K unless noted.
Base-case assumptions
| Annual unit volume | 5,000,000 units |
| Finished-goods value per unit | $10 |
| Current effective false reject rate | 12% |
| AVIS false reject rate (documented case-study basis) | 3% |
| Yield recovery (delta) | 9 percentage points = 450K units = $4.5M/yr |
| Inspector headcount reduction (70% of $2.0M baseline) | $1.4M/yr (Y2+); $1.2M Y1 ramp |
| Re-inspection labor savings | $0.6M/yr |
| Deviation & investigation savings | $1.0M/yr (Y2+); $0.8M Y1 ramp |
| Hardware + integration (CapEx) | $2.0M (Y0) |
| Validation, qualification, IQ/OQ/PQ | $0.5M (Y0) |
| Software, support & maintenance (OpEx) | $0.25M/yr |
| Discount rate | 10% |
| Horizon | 5 years |
Cash flow ($K, parentheses denote outflows)
| Line item | Y0 | Y1 | Y2 | Y3 | Y4 | Y5 |
|---|---|---|---|---|---|---|
| Hardware & integration (CapEx) | (2,000) | — | — | — | — | — |
| Validation & qualification | (500) | — | — | — | — | — |
| Software & support (OpEx) | — | (250) | (250) | (250) | (250) | (250) |
| Yield recovery | — | 4,500 | 4,500 | 4,500 | 4,500 | 4,500 |
| Inspector labor reduction | — | 1,200 | 1,500 | 1,500 | 1,500 | 1,500 |
| Re-inspection labor savings | — | 600 | 600 | 600 | 600 | 600 |
| Deviation / investigation savings | — | 800 | 1,000 | 1,000 | 1,000 | 1,000 |
| Net cash flow | (2,500) | 6,850 | 7,350 | 7,350 | 7,350 | 7,350 |
| Cumulative cash flow | (2,500) | 4,350 | 11,700 | 19,050 | 26,400 | 33,750 |
| Discounted CF @ 10% | (2,500) | 6,227 | 6,074 | 5,522 | 5,020 | 4,564 |
| Cumulative NPV | (2,500) | 3,727 | 9,801 | 15,323 | 20,343 | 24,907 |
Headline financial metrics
| Net Present Value (5-yr, 10%) | $24.9M |
| Internal Rate of Return (IRR) | ~280% |
| Simple payback period | ~5 months (within Year 1) |
| Discounted payback period | ~5 months |
| 5-year undiscounted cumulative cash | $33.75M |
| Year 1 EBITDA contribution | ~$6.6M (CapEx path) |
| Return on invested capital (Yr 1) | ~270% |
Excluded from this model, conservatively, are the regulatory-downside benefits (CRL avoidance, 483 remediation reduction, shortage-risk reduction). On any single launch program these benefits dominate the direct ROI in expected-value terms but are difficult to discount with confidence. They are addressed separately in the sensitivity analysis below.
Section 09 · Sensitivity analysis
The base case is illustrative. The two variables that drive the financial outcome are the volume of the line and the false reject improvement AVIS delivers. Both are line-specific and should be replaced with your operating data when finalizing the business case.
Sensitivity A · 5-yr NPV ($M) by volume × false reject improvement
Yield-only model. Assumes $10/unit, $2.5M CapEx, $250K/yr OpEx, 10% discount, 5-yr horizon. Excludes labor, deviation, and regulatory savings, a deliberately conservative view focused on a single mechanic.
| False reject Δ | 1M units/yr | 2.5M units/yr | 5M units/yr | 10M units/yr |
|---|---|---|---|---|
| 5 percentage points | ($1.6) | $1.3 | $6.0 | $15.5 |
| 7 percentage points | ($0.8) | $3.2 | $9.8 | $23.1 |
| 9 percentage points (base) | $0.0 | $5.1 | $13.6 | $30.7 |
| 11 percentage points | $0.7 | $7.0 | $17.4 | $38.3 |
Read: at the bottom-left of the matrix, a 1M-unit/yr line with only 5 points of false-reject improvement, the yield-only NPV is mildly negative and the deal pencils on operational savings rather than yield. At the top-right, the yield mechanic alone produces $30M+ of NPV. Add the operational savings in the base-case model and every cell moves up by approximately $7M to $9M.
Sensitivity B · 5-yr NPV ($M) by volume × unit value
Yield-only model. Holds false-reject improvement constant at 9 percentage points (base case).
| Unit value ($/unit) | 1M units/yr | 2.5M units/yr | 5M units/yr | 10M units/yr |
|---|---|---|---|---|
| $5 (low-cost generic vial) | ($1.3) | $1.7 | $6.7 | $16.6 |
| $10 (typical sterile injectable) | $0.0 | $5.1 | $13.6 | $30.7 |
| $25 (high-value injectable) | $5.6 | $18.3 | $41.6 | $87.4 |
| $50 (biologic / orphan drug) | $14.0 | $40.4 | $83.7 | $170.5 |
For high-value biologics and orphan drugs, the yield-only NPV alone runs into the high-tens to low-hundreds of millions of dollars. These are the products where false rejects are most expensive in absolute terms and where AVIS’s ability to inspect lyophilized, suspension, and powder-filled formats has the largest financial impact.
Sensitivity C · Base-case NPV by discount rate
Full-model NPV at base-case operating assumptions (5M units/yr, $10/unit, 9pp false-reject improvement, all operational savings included).
| Discount rate (WACC) | Annuity factor (5-yr) | Base-case NPV |
|---|---|---|
| 8% | 3.993 | $26.6M |
| 10% (base) | 3.791 | $24.9M |
| 12% | 3.605 | $23.4M |
| 15% | 3.352 | $21.4M |
| 20% | 2.991 | $18.4M |
Even at a 20% discount rate, well above any pharmaceutical WACC in current market conditions, the base-case NPV remains $18M+, with payback inside Year 1.
Sensitivity D · Risk-adjusted regulatory upside (single launch program)
Expected value of CRL-avoidance attributable to AVIS. Excluded from base case.
| Probability reduction | $1B-NPV launch | $2B-NPV launch |
|---|---|---|
| 1 percentage point | $10M | $20M |
| 3 percentage points | $30M | $60M |
| 5 percentage points | $50M | $100M |
| 10 percentage points | $100M | $200M |
For sponsors with a major launch in flight, the regulatory-downside reduction is typically the single largest source of expected-value uplift in the AVIS business case, and is structurally a CFO-board conversation rather than a plant-floor one.
Evaluation summary: what the numbers reveal
Across these eighteen drivers, the financial pattern is consistent. Yield, time-to-market, and labor produce a near-term ROI that is typically multi-million-dollar per line per year and often pays back the system in well under twelve months. Capital efficiency, working capital released, qualification cycles compressed, defect-library spend avoided, quietly compounds those returns into the second and third year. And the regulatory-downside line, which most operating models systematically under-weight, is where the largest single dollar swings sit: a CRL avoided, a 483 not issued, a shortage not declared. AVIS is engineered specifically against the structural failure modes that drive each of these outcomes.
| Strong financial signal | Weak financial signal |
|---|---|
| Yield recovery worth millions per line as false rejects move from 10-30% to 1-6% | Headline pricing only; no financial model for false-reject yield loss or re-inspection labor |
| Recipe creation in under 60 minutes per SKU; revenue dates pulled forward | Recipe development measured in weeks or months; launch dates exposed to engineering capacity |
| Locked, qualified model with full IQ/OQ/PQ and Part 11 audit trail | Continuous model adaptation; qualification drift; recurring requalification expense |
| No defect library required; novel-defect detection is automatic | Capitalized defect libraries that do not transfer between SKUs and decay over time |
| Economically viable at <1M units/year; orphan and 503B portfolios fully addressable | Economic threshold of ~10M units/year; manual inspection retained on the long tail |
| Regulatory downside priced in: CRL, 483, and shortage probability explicitly reduced | Regulatory downside treated as zero in the operating model |
Next step
Run this model on your own line. Boon Logic will build a line-specific version of the cash flow model and sensitivity analysis above, populated with your unit volumes, finished-goods values, current false reject rates, deviation rates, qualification timelines, and WACC, then benchmark projected AVIS performance using documented case-study data on comparable products. Both CapEx and OpEx structures will be modeled side by side. For most sterile injectable lines the modeled payback is inside Year 1 on operating savings alone, with the regulatory-downside reduction representing the largest source of expected-value upside.